- Foxtable(狐表) (http://www.foxtable.com/bbs/index.asp)
-- 专家坐堂 (http://www.foxtable.com/bbs/list.asp?boardid=2)
---- 图表中的数值显示 (http://www.foxtable.com/bbs/dispbbs.asp?boardid=2&id=133878)
-- 发布时间:2019/4/22 17:49:00
-- 图表中的数值显示
Series.DataLabelText = "{#YVAL}"
这个语句使得图表上的节点显示数据,能不能显示为格式化后的数据
比如有数据点的值为0.9863,0.9657想要显示为98.63% 和 96.57%
这个要怎么搞??
-- 发布时间:2019/4/22 17:58:00
--
参考
http://www.foxtable.com/bbs/dispbbs.asp?BoardID=2&ID=118929&skin=0
-- 发布时间:2019/4/22 19:33:00
--
\'绘图
Dim Chart As WinForm.Chart \'定义一个图表变量
Dim Series As WinForm.ChartSeries \'定义一个图系变量
Dim t As Table = Tables("月FTY") \'定义一个变量t引用数据表
Chart = e.Form.Controls("Chart1") \' 引用窗口中的图表
Chart.VisualEffect = False
Chart.AxisX.DateType = True \'明确指定X轴是日期型
Chart.AxisX.AnnoFormatString = "MM-dd" \'指定日期标示格式
Chart.AxisY.Min = 0.98 \'指定Y轴的最小值
Chart.AxisY.Max = 1 \'指定Y轴的最大值
Chart.AxisY.Major = 0.002 \'主刻度间隔值为
Chart.SeriesList.Clear() \'清除图表原来的图系
For r As Integer = 0 To t.Rows.count - 1
Series = Chart.SeriesList.Add() \'增加一个图系
Series.Text = t.rows(r)("项目名称") \'设置图系的标题
Series.Length = t.Cols.Count - 1 \'设置图系的长度
For c As Integer = 1 To t.Cols.count -1
Series.X(c - 1) = c - 1
Dim str = "" & t.Rows(r)(c) & ""
str = System.Text.RegularExpressions.Regex.Replace(str, "[^0-9.]", "")
Dim yv As Double = val(str) / 100
Series.Y(c - 1) = yv
Chart.AxisX.SetValueLabel(c - 1, t.Cols(c).caption) \'指定字符表示
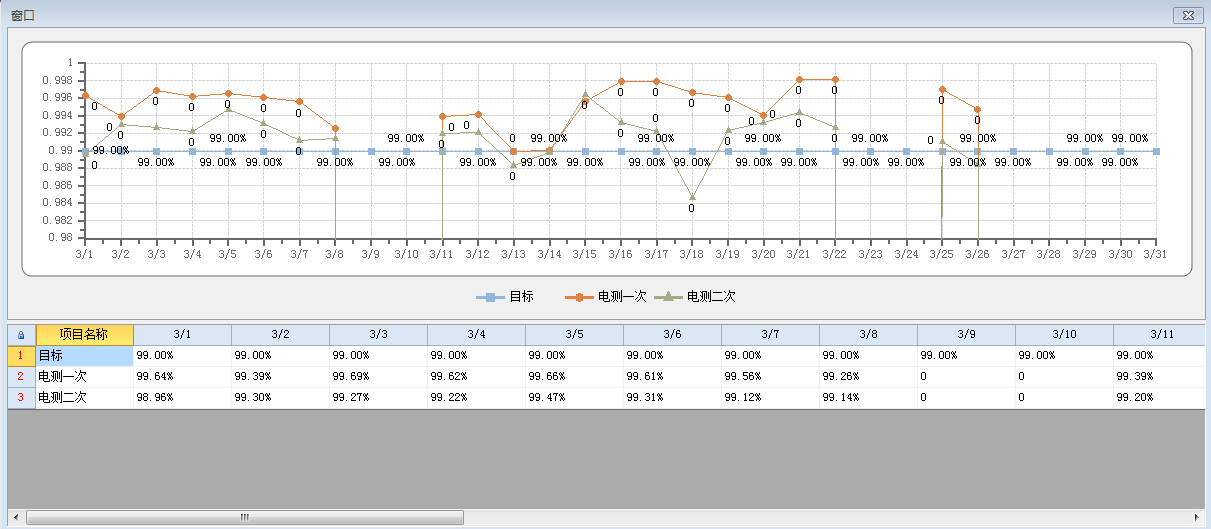
Series.DataLabelText = t.Rows(r)(c)
Next
Next
Chart.AxisX.AnnoWithLabels = True \'启用字符标示
Chart.LegendVisible = True \'显示图列
Chart.LegendCompass= CompassEnum.South \'图列显示在南方(底端)
-- 发布时间:2019/4/22 20:23:00
--
只能使用2楼的方法
-- 发布时间:2019/4/23 10:41:00
--
请具体说明你的问题,做一个对应的实例发上来测试。
 此主题相关图片如下:02.png