绘制多边形
本节内容可以参考CaseStudy目录下的文件"地图.Table"的示例五。
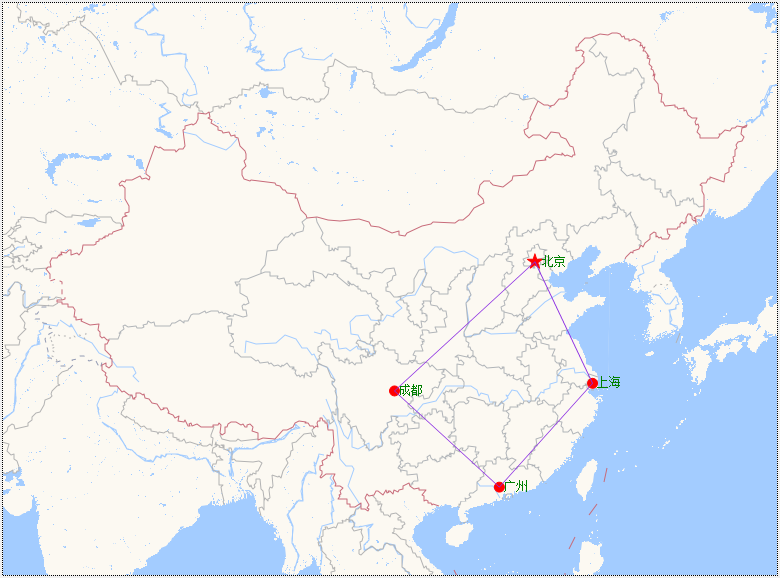
本节的任务是在地图上绘制一个多边形:
示例一
1、将Map控件的"地图来源"属性设置为"Custom"
2、将Map控件的GetMapTile事件代码设置为:
Dim
style
As
Integer
= 8
'地图类型,可选值为6到10,其中6为卫星图
Dim
size
As
Integer
= 1
Dim
scale
As
Integer
= 1
Dim
server
As
Integer
= Rand.Next(1, 5)
'随机使用1到4号服务器
Dim
scl
As
Integer
= 2
'设置为2可以隐藏地图的文字标注,且分辨率更好
Dim
Language
As
String
=
"zh_cn"
'中文地图,如果需要英文可设置为"en",我
测试只有style为8的时候才支持英文
Dim
url
As
String
If
style = 7
OrElse
style = 8
Then
url =
Else
url =
End
If
e.URI = CExp(url, server, Language, Size, scale, style, e.X, e.Y, e.Z, scl)
3、将窗口的AfterLoad事件代码设置为:
Dim
map
As
GeoMap = e.Form.Controls("Map1").GeoMap
Dim
layer
As
New
VectorLayer()
'定义矢量层
layer.LabelVisibility =
LabelVisibility.Visible
'标题可见
layer.Style.Stroke.Color =
Color.Red
'标记边框为红色
layer.LabelStyle.ForeColor =
Color.Green
'标题为绿色
map.Layers.Add(layer)
'将矢量层增加代map控件中
'定义各城市的经纬度
Dim
cities
As
New
Dictionary(Of
String,
GeoPoint)
cities.Add("北京",
New
GeoPoint(116.4053, 39.905))
cities.Add("上海",
New
GeoPoint(121.4726, 31.2317))
cities.Add("广州",
New
GeoPoint(113.2806, 23.1252))
cities.Add("成都",
New
GeoPoint(104.0657, 30.6595))
'逐个绘制城市
For
Each
city
As
String
In
cities.Keys
Dim
mark
As
New
VectorPlacemark()
'增加一个标记
mark.Marker.Caption = city
'指定
标题
mark.Geometry =
cities(city)
'标记位置为城市的经纬度
If
city =
"北京"
Then
'如果是北京
mark.Marker.Size =
New
SizeF(16, 16)
'指定
标记大小
mark.Marker.Shape = MarkerShape.Star
'标记为五角星
Else
mark.Marker.Size =
New
SizeF(10, 10)
'其他城市的
标记要小一些
mark.Marker.Shape = MarkerShape.Circle
'且
标记为圆形
End
If
mark.Marker.LabelPosition = LabelPosition.Right
'标题显示在
标记右边
mark.Style.BackColor = Color.Red
'标记的填充颜色为红色
layer.Items.Add(mark)
'将
标记添加到矢量层中
Next
'绘制多边形
Dim
points()
As
GeoPoint = {cities("北京"),
cities("上海"),
cities("广州"),
cities("成都")}
'指定多边形各点的经纬度
Dim
polygon
As
VectorPolygon = map.CreatePolygon({points})
'创建多边形
polygon.Style.Stroke.Color =
Color.BlueViolet
layer.Items.Add(polygon)
'将多边形添加到矢量层中
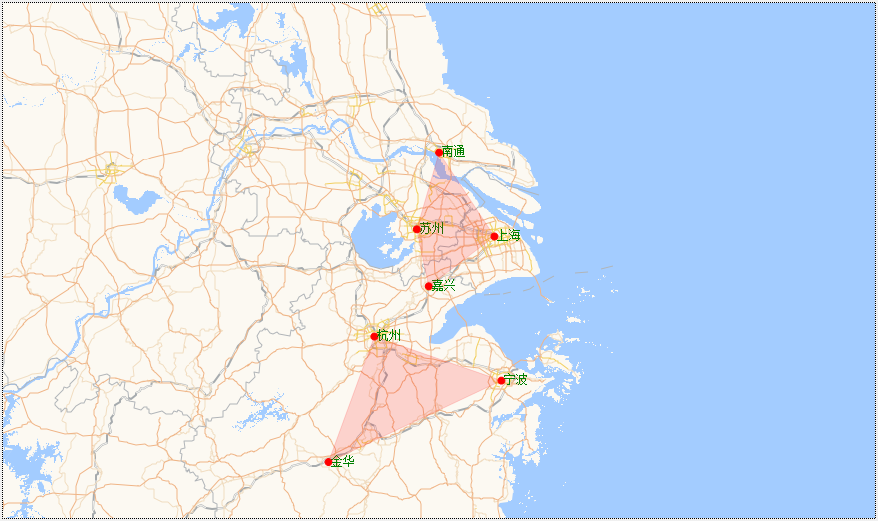
示例二
本示例可以参考CaseStudy目录下的文件"地图.Table"的示例六
多边形的类型为VectorPolygon
,一个VectorPolygon可以包括多个多边形。
这样就
可以将多个多边形作为一个整体绘制,整体绘制的好处是这些多边形可作为一个单一对象进行设置,也可以作为单一对象响应事件,例如行政区域的飞地。
例如我们可以在上一节的基础上,将AdfterLoad事件代码改为:
Dim
map
As
GeoMap = e.Form.Controls("Map1").GeoMap
Dim
layer
As
New
VectorLayer()
'定义矢量层
layer.LabelVisibility = LabelVisibility.Visible
'标题可见
layer.Style.Stroke.Color = Color.Red
'标记边框为红色
layer.LabelStyle.ForeColor = Color.Green
'标题为绿色
map.Layers.Add(layer)
'将矢量层增加代map控件中
'定义各城市的经纬度
Dim
cities
As
New
Dictionary(Of
String,
GeoPoint)
cities.Add("上海",
New
GeoPoint(121.4726, 31.2317))
cities.Add("南通",
New
GeoPoint(120.8646, 32.0162))
cities.Add("苏州",
New
GeoPoint(120.6196, 31.2994))
cities.Add("嘉兴",
New
GeoPoint(120.7509, 30.7627))
cities.Add("杭州",
New
GeoPoint(120.1536, 30.2875))
cities.Add("金华",
New
GeoPoint(119.6495, 29.0895))
cities.Add("宁波",
New
GeoPoint(121.5498, 29.8684))
'逐个绘制城市
For
Each
city
As
String
In
cities.Keys
Dim
mark
As
New
VectorPlacemark()
'增加一个标记
mark.Marker.Caption = city
'指定
标题
mark.Geometry = cities(city)
'标记设置为城市的经纬度
mark.Marker.Size =
New
SizeF(7, 7)
'标记大小
mark.Marker.Shape = MarkerShape.Circle
'标记为圆形
mark.Marker.LabelPosition = LabelPosition.Right
'标题显示在
标记右边
mark.Style.BackColor = Color.Red
'标记的填充颜色为红色
layer.Items.Add(mark)
'将
标记添加到矢量层中
Next
'绘制多边形
Dim
ps1()
As
GeoPoint = {cities("上海"),
cities("南通"),
cities("苏州"),
cities("嘉兴")}
'指定第一个多边形各点的经纬度
Dim
ps2()
As
GeoPoint = { cities("杭州"),
cities("金华"),
cities("宁波")}
'指定第二个多边形各点的经纬度
Dim
polygon
As
VectorPolygon = map.CreatePolygon({ps1, ps2})
'创建多边形
polygon.Style.Stroke.Color = Color.FromArgb(40, 255, 0, 0)
'边框颜色为透明红色
polygon.Style.BackColor = Color.FromArgb(40, 255, 0, 0)
'背景颜色为透明红色
layer.Items.Add(polygon)
'将多边形添加到矢量层中
绘制的多边形如下: